Maui
Free satellite radar, turned into a map of how wet the ground is on any New Zealand farm — through cloud, day or night.
Radar, not a camera
Most satellite imagery is photography. If there's cloud in the way, you get a picture of the cloud.
Radar doesn't work like that. The satellite sends down a pulse and listens for the echo, the way a dolphin reads the water around it. Cloud doesn't stop it. Nor does night.
That's the whole reason this exists. New Zealand is a cloudy country, and the tools farmers have mostly stop working exactly when the weather turns.
How it reads wetness
Wet ground sends back a different echo than dry ground. The trouble is that every patch of land has its own signature — a north-facing slope, a gully, heavy soil and light soil all sound different to a satellite, regardless of how wet they are.
So the trick is not to compare one place to another. Each 10-metre square is compared to its own history — four years of it, every pass the satellite made. The question isn't "is this wet?" but "is this wetter than this exact spot normally gets?"
That gives a number from 0 to 100 for every square, on every date the satellite flew over.
What it looks like
Ballantrae, an AgResearch hill farm in the Manawatū. Same farm, four seasons, averaged across four years of passes. Darker is wetter.
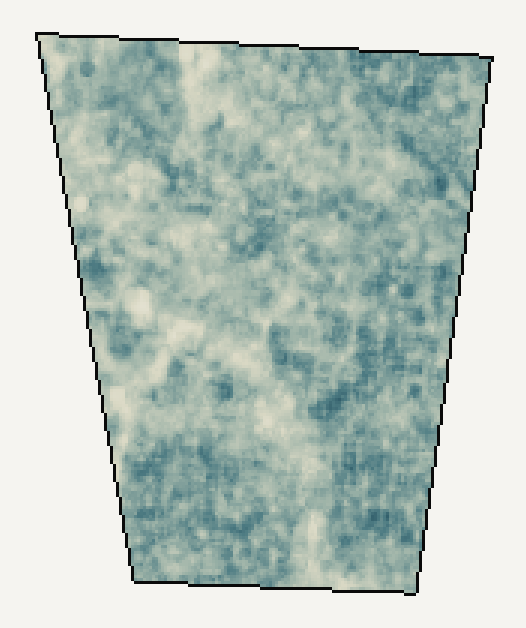
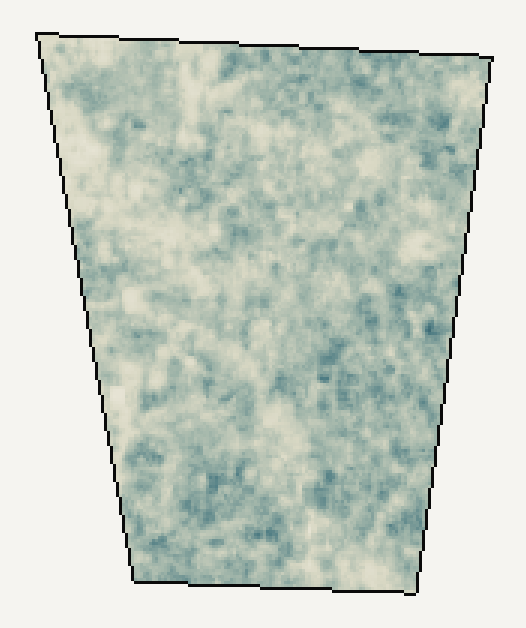
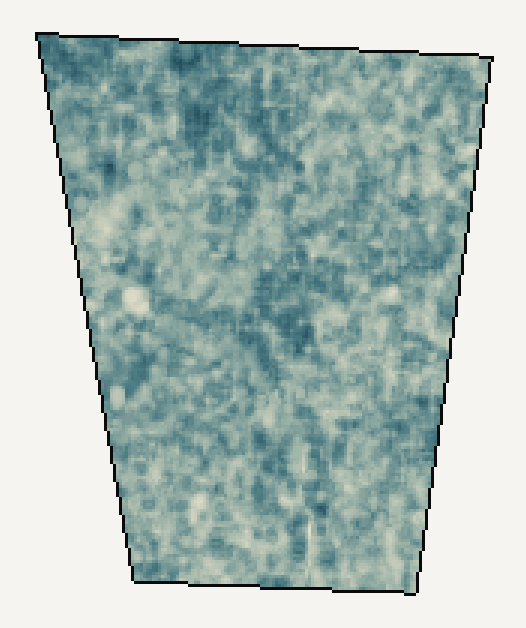
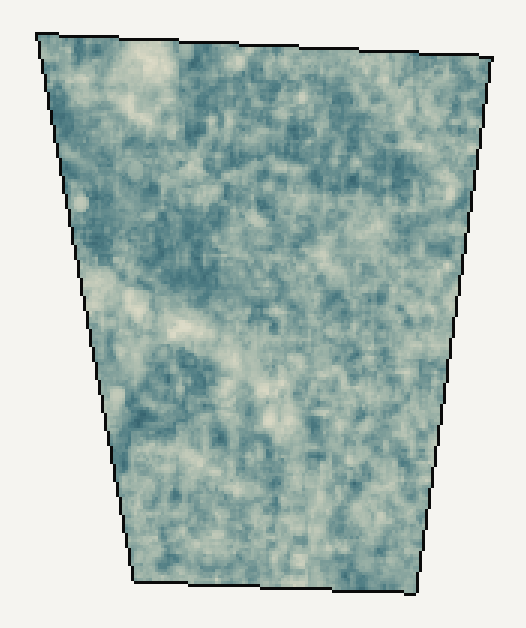
You can see the gullies hold water and the ridges shed it, and you can see the whole farm wet up through winter.
How much detail
Both of these are the same farm on the same day. The left is what this engine produces. The right is the best free soil-moisture product NASA publishes.
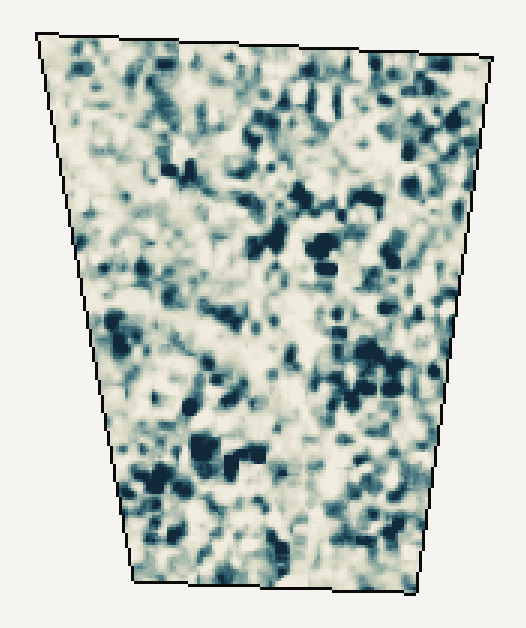

Same satellites, same free data. The difference is the processing.
What it can't do
This matters more than the part above, so it's stated plainly.
- It doesn't measure how much grass is there. That's the hard problem and it isn't solved. Doing it needs thousands of paired measurements from real paddocks, which is what I'm chasing now.
- It's a relative number, not millimetres of water. It says "wetter than this spot usually is", not "0.28 cubic metres per cubic metre". Turning it into real units needs probes in the ground to anchor it.
- It's shallow. Roughly the top centimetre or two of soil, and shallower when the ground is already wet.
- It's not continuous. A few passes a month, not a live feed.
- Nothing here has been checked against a soil probe yet. It behaves sensibly and the patterns look like the landscape, but that isn't proof.
Where it's at
The pipeline runs by itself, twice a day, on free data from the European and American space agencies. It has produced per-square wetness for farms going back to 2022, and that data is now with scientists at the Bioeconomy Science Institute, who are testing it.
The next step is calibration: getting hold of real ground measurements and finding out how closely this tracks them. That's the difference between an interesting map and a measurement.